Flood Risk Technology, Part I: An Overview
Allison, Katrina, Sandy, and Harvey are names that will forever be synonymous with the United States—for all the wrong reasons.
They were each the “perfect storm” that left cities and regions underwater, shattered lives, and caused billions of dollars in property damage.
Tropical Storm Allison blew into Texas in June 2001 and, through two massive rainfalls, dumped 38.8 inches of rain on Houston at its highest recorded measurement. The storm ravaged the city, causing more than $5 billion in property damage.
In late August 2005, Katrina struck New Orleans as a Category 3 hurricane. While the storm itself—spanning 400 miles across—caused significant damage, the levee breaches throughout the city produced a catastrophic situation. At one point, nearly 80 percent of New Orleans was impacted by flooding to some degree. Katrina caused more than $108 billion in damage to the Gulf Coast, according to FEMA, which called the storm “the single most catastrophic natural disaster in U.S. history.”
Sandy, notably called “Superstorm Sandy,” was unique because it impacted the entire eastern seaboard in late October 2012. Sandy battered New England and produced a record 13.88-foot storm surge into New York City. Property damage in the U.S. was assessed at more than $70 billion, and shoreline erosion was massive, especially along the New Jersey coast.
Finally, Houston and many surrounding cities are still reeling from Hurricane Harvey, which hovered over the region for five days in late August and left an epic 51 inches of rain in some areas when it was over. Property damage estimates have surpassed $100 billion.
A Tropical Storm Allison public report published by FEMA and the Harris County Flood Control District in 2002 predicted the inevitable arrival of Harvey: “The hard fact is: In addition to the many attributes that have attracted people to this area through the years, Houston and Harris County also have an established history of violent weather—the kind of history that frequently repeats itself,” the report noted. “We should expect another deadly rainmaker to visit the area someday.”
Hurricane Harvey reinforced that something more powerful and more damaging is not just possible, but probable.
More Than 50 Years of Advancements
While these storms were devastating in their own unique ways, they have also had a great impact on the evolution of technology to identify flood risk, bring awareness to the forefront in a proactive manner, and help make smarter, informed decisions.
The ultimate goal is to know where low-lying, flood-prone areas exist within our cities and communities—areas that could be at risk. It’s to know where water is going to cross a roadway. It’s to make available the most accurate information before, during, and following extreme rainfall events. It’s to help make our neighborhoods—even those outside of the flood zone—safer and minimize the loss of life during future floods.
Updating floodplains is not an easy process, but technology has evolved astronomically in the last 50-plus years to create new data and help determine flood risk.
Over the next several months, Halff will present a series of Insights about the evolution of technology to identify flood risk. We’ll explore the following topics:
- Rainfall: historical records and climate variability
- Modeling technology
- The paper-to-digital revolution
- Real-time forecasting
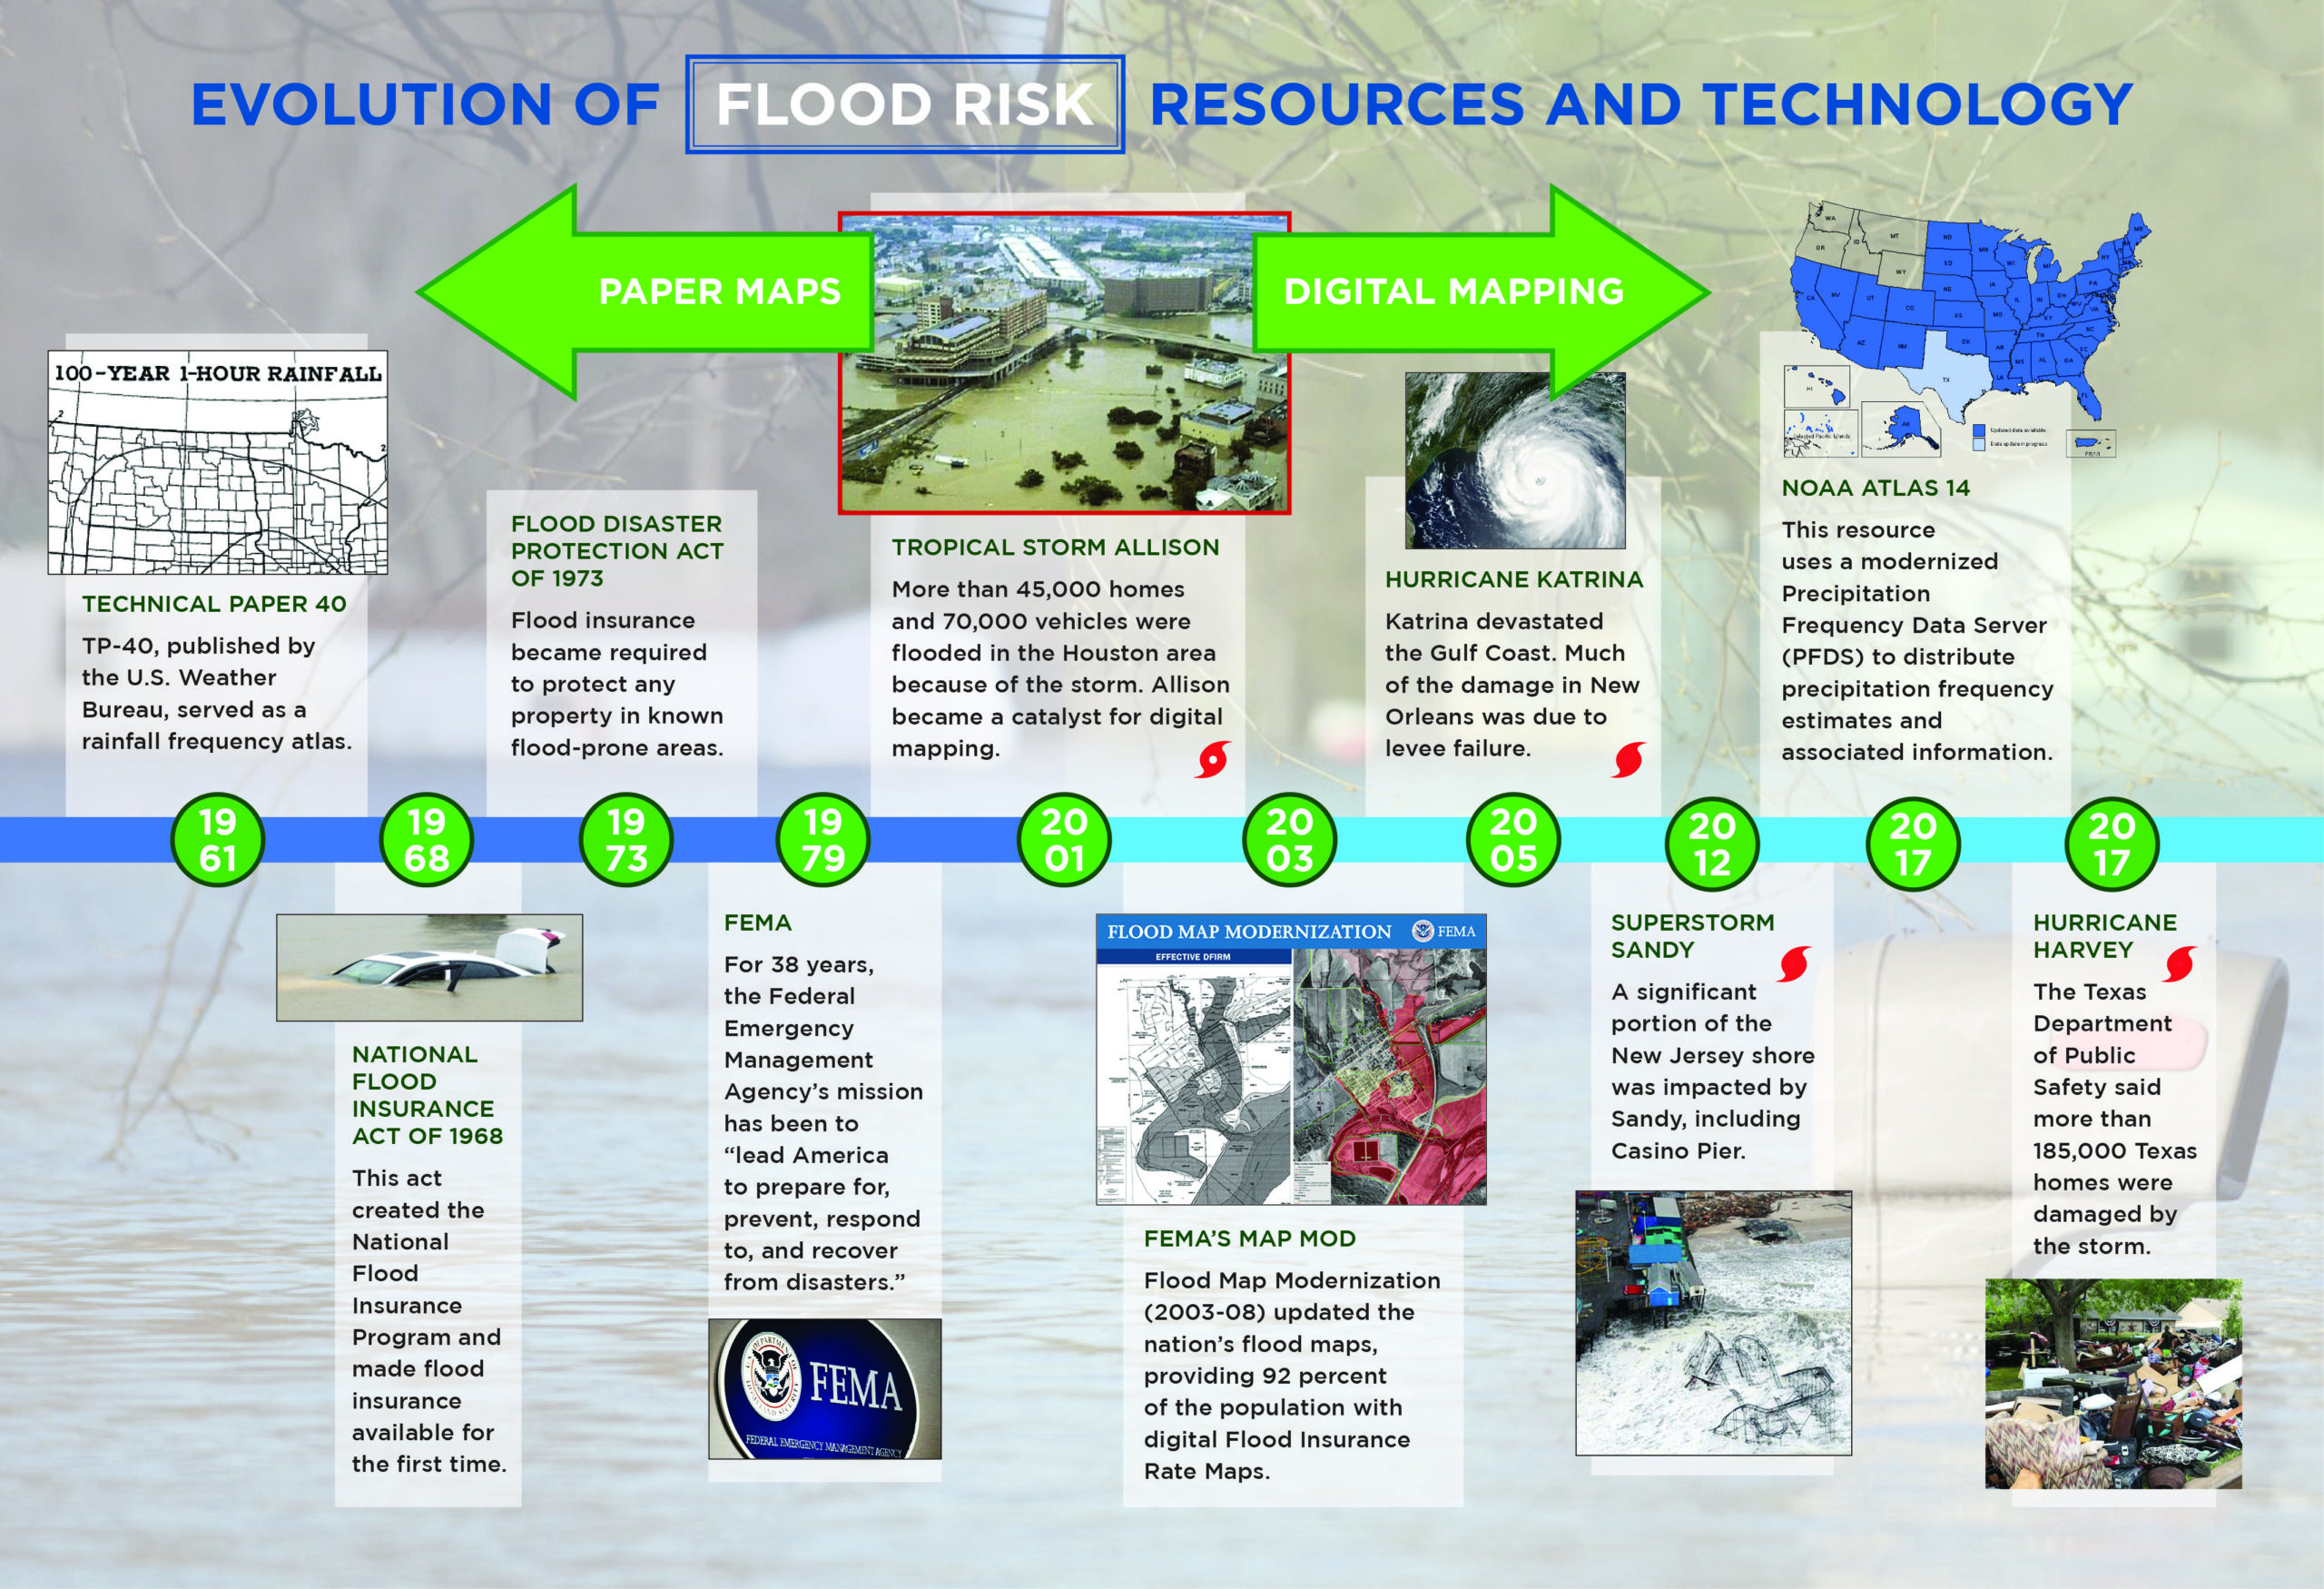
The following timeline breaks down significant milestones in flood risk analysis. (Click on the image for an enlargement.)
For more information about flood risk technology or Halff’s Water Resources team, write to Info-Water@Halff.com.
Recent Stories

Halff Honors Samantha Kaschel with 2026 HCI Outstanding Volunteer Award
Samantha Kaschel (center) was presented with Halff’s HCI Outstanding Volunteer Award by Senior Vice President Leigh Hollis (right) and Deputy…
Transportation Policy is Now Under a Magnifying Glass: Here’s What to Know
The country is facing a shot clock for the reauthorization of surface transportation infrastructure funding. The current federal transportation authorization…